
 A report released by the National Statistical Office (NSO), Ministry of Statistics and Programme Implementation on November 23, 2019 on the basis of a survey on Drinking Water, Sanitation, Hygiene and Housing Condition has almost corroborated a study by Indian Institute of Technology, Kharagpur earlier this year. The IIT Kharagpur study had observed that rising income and improved access to sanitation facilities has led to a decrease in disease-causing bacteria that cause acute diarrhea in groundwater.
On October 2, 2019, Prime Minister Narendra Modi declared India to be open defecation free with toilet coverage increasing from 38.7 per cent in 2014 to 100 per cent in 2019. The study, published in a Nature group of journals, Scientific Reports that the concentration of faecal coliform in groundwater had reduced by 38.5 per cent. Coliform are organisms that are found in the environment and the faeces of warm-blooded animals; their presence is used as a proxy for pathogens in water samples.
The progress, however, is not uniform across regions. Of the 7,010 blocks that were covered in the study, nearly 43 per cent or 3,000 blocks showed over 90 per cent reduction in faecal coliform during the study period. It decreased by 70-90 per cent in nearly 23 per cent of the regions, and 50-70 per cent in 7.1 per cent of the study regions. In 24 per cent of the blocks studied, the faecal coliform concentration in groundwater went down by less than 50 per cent.
The study clearly shows a relation between the Prime Minister’s Swacch Bharat Mission and improvement in water quality and health.
Analysis of the data shows that the rate of decrease in faecal coliform concentrations was 3.09 per cent and that of acute diarrhea 2.69 per cent per year for the last three decades. Since 2014, when the mission was launched, the average pace of this change increased drastically to 6.02 per cent and 7.96 per cent per year respectively. The researchers, however, saw that in the group of blocks that showed minimal improvement during the study period, the improvement in the economic condition and access to sanitation did not have strong correlation with better health outcomes.
The survey conducted by National Statistical Office was done to collect information on facilities of drinking water, sanitation along with housing facilities available to the households and the microenvironment surrounding the houses, which are important determinants of overall quality of living condition of the people.
The survey was spread across the country and for the central sample, data were collected from 1,06,838 households (63,736 in rural areas and 43,102 in urban areas) from 5,378 sample villages in rural areas and 3,614 sample UFS blocks in urban areas, following a scientific survey methodology. This report is based on the central sample data collected through the survey on Drinking Water, Sanitation, Hygiene and Housing Condition during NSS 76th round.
Drinking water facility
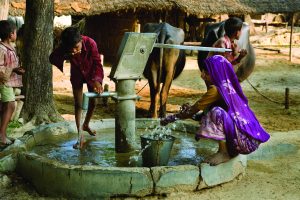
Significantly, the NSS survey found that major source of drinking water was hand pump for the households in the rural areas and piped water into dwelling in the urban areas. About 42.9 per cent of the households in the rural areas used hand pump as the principal source of drinking water and about 40.9 per cent of the households in the urban areas used piped water into dwelling as the principal source of drinking water. About 48.6 per cent of the households in the rural and about 57.5 per cent in the urban areas had exclusive access to principal source of drinking water.
Another observation of the survey was that about 87.6 per cent of the households in the rural and about 90.9 per cent in the urban areas had sufficient drinking water throughout the year from the principal source. About 58.2 per cent of the households in the rural and about 80.7 per cent in the urban areas had drinking water facilities within the household premises.
About 94.5 per cent of the households in the rural and about 97.4 per cent in the urban areas used ‘improved source of drinking water’ viz. bottled water, piped water into dwelling, piped water to yard/plot, piped water from neighbour, public tap/standpipe, tube well, hand pump, protected well, public tanker truck, private tanker truck, protected spring and rainwater collection. About 51.4 per cent of the households in the rural and about 72.0 per cent in the urban areas used improved source of drinking water, sufficiently available throughout the year located in the premises.
Sanitation facility
The NSS survey found that about 50.3 per cent of the households in the rural and about 75.0 per cent in the urban areas had exclusive access to bathroom. About 56.6 per cent of the households in rural and about 91.2 per cent in urban areas had access to bathroom. Among the households, which had access to bathroom, about 48.4 per cent in the rural areas and about 74.8 per cent in the urban areas used bathroom attached to the dwelling unit.
About 71.3 per cent of the households in the rural and about 96.2 per cent in the urban areas had access to latrine. It may be noted that there may be respondent bias in the reporting of access to latrine as question on benefits received by the households from government schemes was asked prior to the question on access of households to latrine. About 48.0 per cent of the households in the rural areas and about 86.1 per cent of the households in the urban areas had bathroom and latrine both within household premises.
Dwelling units
About 96 per cent of the households in the rural and about 63.8 per cent in the urban areas had their own dwelling unit. Among the households living in houses (i.e. households with dwelling units), about 96.7 per cent of the households in the rural and about 91.5 per cent in the urban areas used the house for residential purpose only.
Among the households living in houses, about 89.0 per cent of the households in the rural and about 56.4 per cent in the urban areas had independent house. Among the households living in houses, about 76.7 per cent of the households in the rural and about 96.0 per cent in the urban areas had the house of pucca structure. Among the households living in houses, average floor area of the dwelling unit was about 46.6 sq. m. in the rural and about 46.1 sq. m. in the urban areas. Among the households living in houses, about 93.9 per cent of the households in the rural and about 99.1 per cent in the urban areas had electricity for domestic use.
Micro environment
Among the households living in houses, about 48.3 per cent of the households in the rural and about 86.6 per cent in the urban areas used LPG as fuel for cooking. Among the households living in houses, about 61.1 per cent of the households in the rural and about 92.0 per cent in the urban areas had drainage system in the house for disposal of waste water/liquid waste.
Among the households living in houses, about 48.1 per cent of the households in the rural areas disposed off household waste water without treatment to open low land areas/streets. In the urban areas, about 71.1 per cent of the households disposed off household waste water without treatment to drainage system.
Among the households living in houses, about 72.4 per cent of the households in the rural areas disposed off household garbage either in household’s individual dumping spot or in a common place other than community dumping spot. In the urban areas, about 70.3 per cent of the households disposed off household garbage either in community dumping spot or in a common place other than community dumping spot.
The study reveals that among the households living in houses, about 87.1 per cent of the households in the rural and about 95.7 per cent in the urban areas had the house with direct opening to approach road/lane/constructed path.
letters@tehelka.com


